Daily Leverage Certificates
DLC Hotline: (65) 6226 2828
Market Commentary (Hong Kong)
For the week ending 14 June 2024
The Dollar Index DXY expanded strongly this week closing at a six-week high. Yields in both the US 10 and 30-year government bonds fell to 10-week lows.
● Turkey will impose a 40% duty on Chinese vehicle imports starting from 07 July.
● EC will impose an additional provisional duty of between 17.4 percent to 38.1 percent on EVs from China over an existing 10% tariff.
● Apple introduced artificial intelligence features including a partnership with OpenAI.
● Saudi Arabia will not renew its 50-year petrodollar agreement with the US, which expired 09 June 2024.
● The FOMC held rates unchanged.
● Russia stopped trading US dollars and Euros on the Moscow Exchange.
● According to disclosures, the Canada Pension Plan Investment Board bought Apple, Tesla and NIO but sold Ford and GM.
● Reuters reported that hundreds of fasteners were found incorrectly installed on the Boeing 787 Dreamliner.
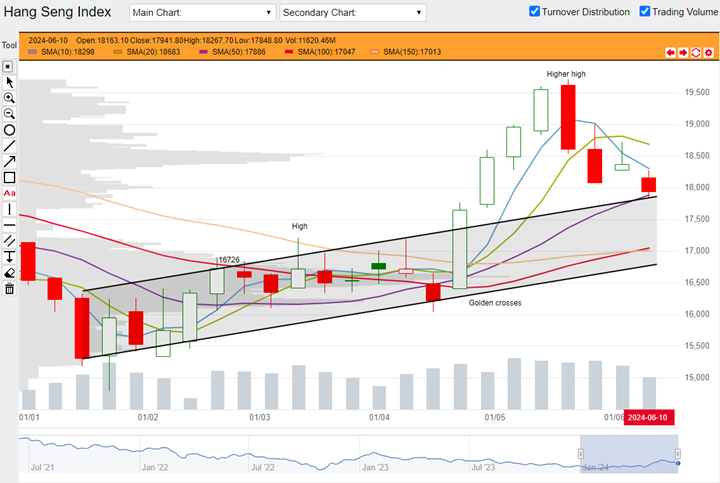
Hang Seng Index closed this week at 17942, down 425 points or 2.31%. This week’s candle is confined between its 10-Day SMA overhead and its 50-Day SMA below. The candle’s lower tail could be an acknowledgement to the 50-Day SMA. HSI printed a higher high in May this year which is a higher swing high compared to the previous high in March. This setup in addition to the number of golden crosses printed in April are associated with further gains.

HSI weekly chart from 01 January 2024 to 14 June 2024 (Source: DLC.socgen.com)
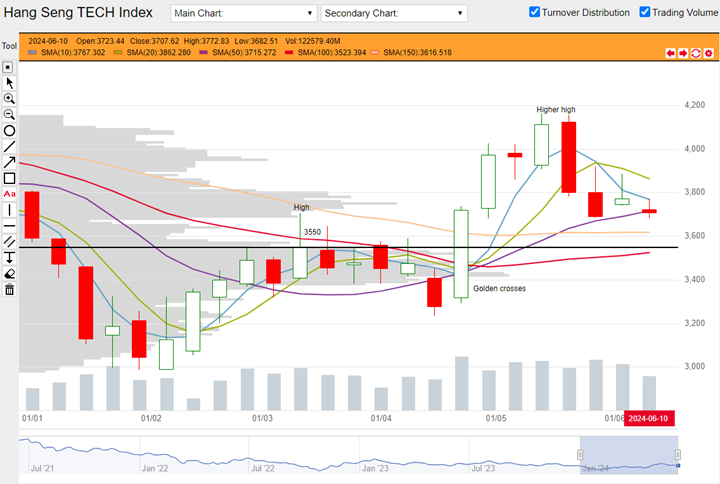
Hang Seng Tech closed the week at 3708, down 65 points or 1.72%. This week’s candle closed between its 10-Day and 50-Day SMAs. Both its higher and lower tails appear to comply with these averages. HSTech printed a higher swing high in May this year compared to the previous swing high in March. This higher high structure together with the series of golden crosses printed in April are associated with further gains.

HSTech weekly chart from 01 January 2024 to 14 June 2024 (Source: DLC.socgen.com)
The Nasdaq 100 made another new all-time high while the Dow fell to a six-week low. Dow closed below its 10, 20, 50 and 100-Day SMAs.
The next FOMC meeting is scheduled on 31 July 2024.
Fed funds futures on rate hike probability by next Fed meeting as at this week’s close:
● 10.3% probability of 25 basis points cut |89.7% probability of no change
Fed funds futures on rate hike probability by next Fed meeting at last week’s close:
● 2.2% probability of 25 basis points cut |97.8% probability of no change
Probabilities on the CME Fedwatch Tool indicate a 25-basis points cut could start as early as the coming FOMC meeting in July. There is also a possibility for a cumulative 100 basis points cut between now to December this year.
Week to week Shanghai and Shenzhen continued to fall although Shenzhen closed this week in a positive candle. Both indices sport a lower tail in their candlesticks which means there could be some buying and intraweek support. Their 10 and 20-Day SMAs however are falling and diverging which means that short term momentum is clearly downwards. Both indices also closed in the vicinity of their last swing low printed in April this year.
Other news:
● AIA, Meituan, Tencent, Wuxi Bio and Xiaomi bought back shares.
● CNOOC and Cosco Shipping printed new 52-week highs. Baidu, Sands China and Wuxi Biologics printed new 52-week lows.
● A recent study by market research firm IDC found that Baidu’s generative AI products were top performers in their categories.
Technical observations
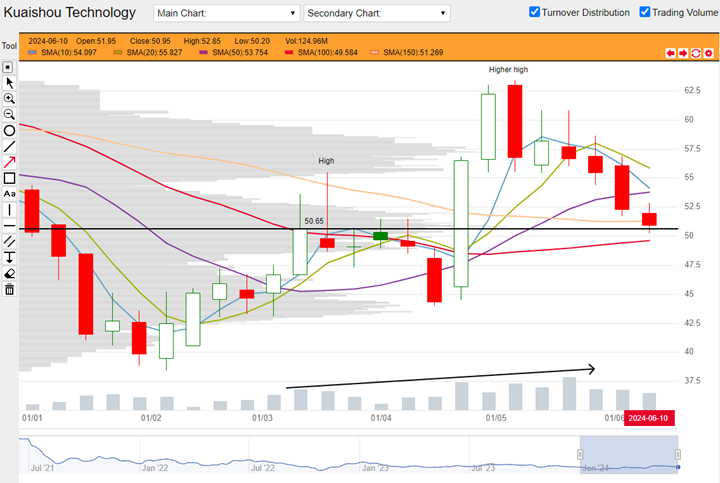
Kuaishou 1024.hk sitting on previous swing high, increased volume.
Note chart features:
1. Kuaishou printed a higher swing high in May this year compared to the previous one in March. Together with the series of golden crosses below, this setup is associated with further gains. The highest end-of-week close in the March swing high is $50.65. This week’s close is near to this level. In conjunction, the 100 and 150-Day SMAs could offer potential support.
2. Note that the volume histogram throughout higher swing high is taller than the previous. This indicates greater trade in the stock as price gained higher. This is a positive technical sign that is supportive of uptrends.

Kuaishou 1024.hk weekly chart from 01 January 2024 to 14 June 2024. (Source: DLC.socgen.com)
Underlying Index/Stock |
Underlying Chg (%)1 |
Long DLC (Bid Change%2) |
Short DLC (Bid Change%2) |
|---|---|---|---|
| Hang Seng Index (HSI) | +1.35% | CVMW (+5.14%) | EUCW (-7.74%) |
| Hang Seng TECH Index (HSTECH) | +2.46% | YPCW (+13.64%) | Y9GW (-6.06%) |
| Kuaishou Technology (1024.HK) | +4.94% | VLLW (+24.37%) |
Brought to you by SG DLC Team
This advertisement has not been reviewed by the Monetary Authority of Singapore. This advertisement is distributed by Société Générale, Singapore Branch. This advertisement does not form part of any offer or invitation to buy or sell any daily leverage certificates (the “DLCs”), and nothing herein should be considered as financial advice or recommendation. The price may rise and fall in value rapidly and holders may lose all of their investment. Any past performance is not indicative of future performance. Investments in DLCs carry significant risks, please see dlc.socgen.com for further information and relevant risks. The DLCs are for specified investment products (SIP) qualified investors only.
Full Disclaimer - here